Elevation Study
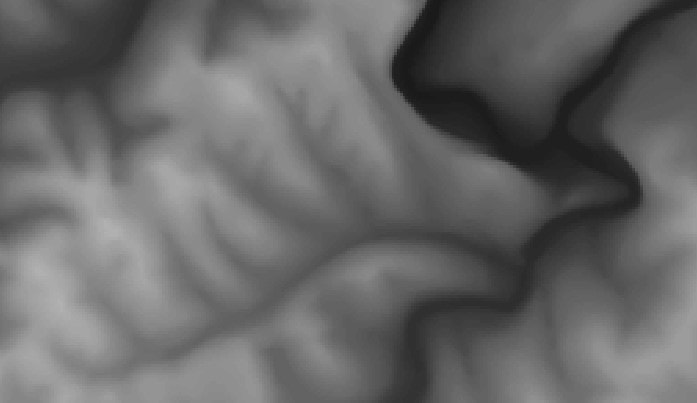
Figure 1: Portion of Perryville Battlefield DEM
DEMS (Digital Elevation Model) are files that show elevation and are available from numerous websites. The highest resolution seamless DEMS of the entire country are 1/3 of an Arc-Second pixels. There are projects to increase the resolution to 1-meter[1]. A DEM is a raster image; the physical size that the pixels represent will determine the variations in elevation data.[2]
For example much of Kentucky is now mapped at a 5k resolution (5000 ft x 5000 ft). The previous size of the tile was 7.5 Arc minutes. Thus the elevation difference are much smaller.
For example much of Kentucky is now mapped at a 5k resolution (5000 ft x 5000 ft). The previous size of the tile was 7.5 Arc minutes. Thus the elevation difference are much smaller.
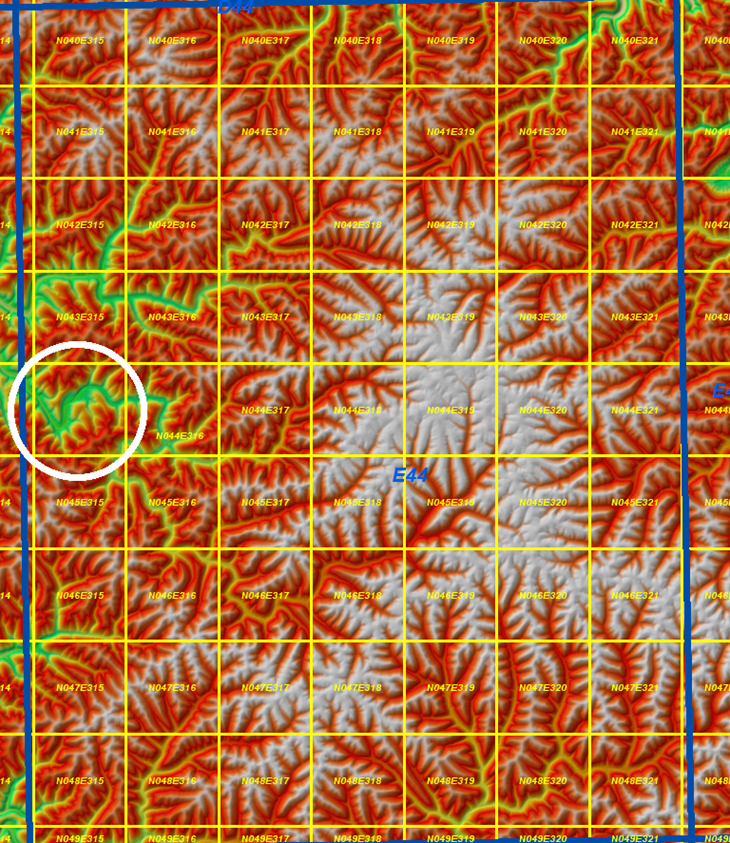
Figure 1A: Each yellow square represents 5000 ft and the blue square is the 7.5 Arc Minute quad. Image provided by Demetrio Zourarakis
Most DEMs were derived from LIDAR data, with varying resolution, some of the most precise DEMs are in the 1 meter range. DEMs are generally initially viewed in gray scale as seen in Figure 1. In Figure 2 the image has been modified through symbology with a ramp color, dark brown being higher elevations and green the lower elevations. See the LIDAR lesson for more information how the information is obtained or follow the hyperlink. http://cit225.weebly.com/remote-sensing.htm
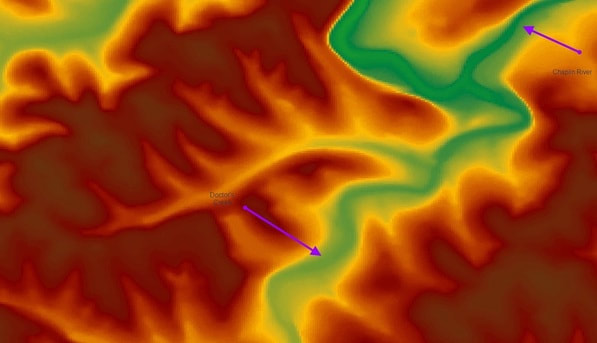 Figure 2: Colorized DEM of a portion of Perryville Battlefield
The DEM for the Perryville battlefield was obtained from the Kentucky Division of Geographic Information (DGI)[3]. It can also be obtained from the United States Geographic Survey (USGS). The target area was downloaded and mosaic tool from the ArcToolbox was used. This area of Kentucky has rolling hills which were an important factor in this battle. The DEM for the Perryville battlefield can be downloaded at: http://216.69.2.36/CIT_145/perryville.zip
Note: the author has provided direct files for this lesson, for other projects the learner will need to locate and download the appropriate information. DEMs from DGI must be converted to a raster first using ArcToolbox and then projected. Files from USGS, are in a format that is already projected and can be used directly. Multiple DEMs must be mosaiced together before use. The DEM and the image should align.
Creating a Contour
Creating a Contour
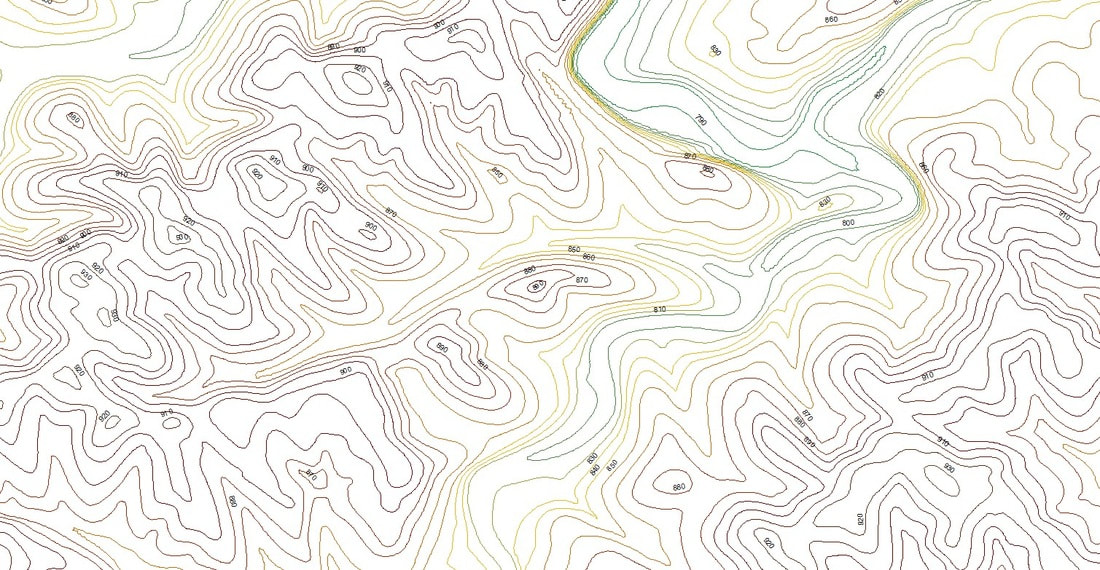
Figure 3: Contour of a Potion of the Perryville Battlefield, same General Area as Figure 1.
A contour is a series of elevation lines, each of the different colored lines represents a different height. The lines are created using the ESRI ArcMap Desktop 3D Analysis tool, Symbology was used to give the lines different colors. The Contour tool is located in ArcToolbox in the 3D Analysis toolset under Raster Surfaces; do not use the 3D Analysis Toolbar which contains a limited set of tools.
- The contour is created by inputting the DEM file,
- creating a storage location, for a new vector file (feature class or shapefile)
- using an appropriate naming convention
- suggesting the vertical distance between the contour lines. The user may need to confirm the measurement units by reviewing the metadata.
- The created contour file will be monochromatic
- by using symbology a colored contour can be created.
- On many maps the contour lines are shown bolder at major divisions, the lines are monochromatic and the thickness will vary depending on the purpose of the map.
- In general, contour lines are thin and lightly colored, since they are value added information on a map.
Hillshade and Slope
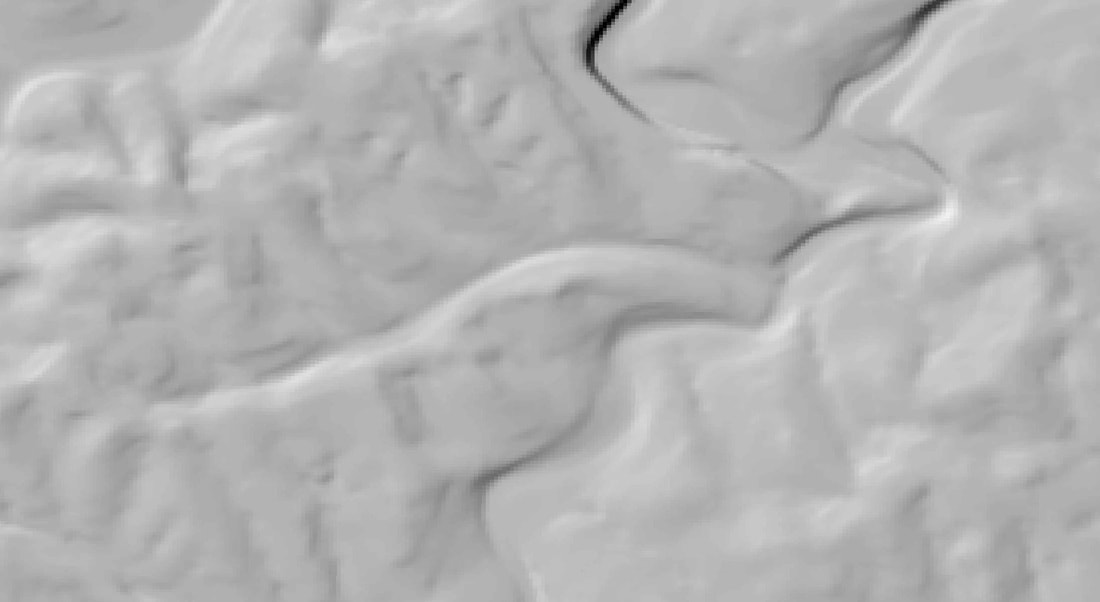
Figure 4: Hillshade of the Perryville Battlefield, similar area as Figure 3 in Research part.
A Hillshade image will give a simulated three dimensional appearance. A Hillshade layer can be created using the Hillshade tool in the Raster Surface toolset of the 3D Analysis tools of the ArcToolbox. A Hillshade layer brings out the depth of the elevation differences and can be placed as a layer beneath the orthographic image; to show height. This is accomplished by making the orthographic layer semi-transparent to see the depth of the Hillshade layer. Both the Hillshade and the orthographic image layer are opaque, only the lower layer is visible when the display transparency of the upper layer is greater than 0%. A Hillshade is created by providing four parameters.
- The first two are required but it is strongly suggested that the other two be provided. The raster layer is from a DEM file and is used as the input.
- The output file is stored in the project storage location with an appropriate naming convention.
- The azimuth angle is pre-selected at 315 degrees but can be modified. The azimuth is the view angle with due north being zero measured clockwise. 315 degrees would be viewed from the northwest.
- The final parameter is the altitude which is predefined at 45 degrees. The Altitude is 0 degrees if viewed horizontal and 90 degrees if viewed vertical. The user should use the same DEM and experiment with different altitude and azimuth angles to see how the results vary. The resulting file is a raster, Figure 4 was created with the default values.
TIN
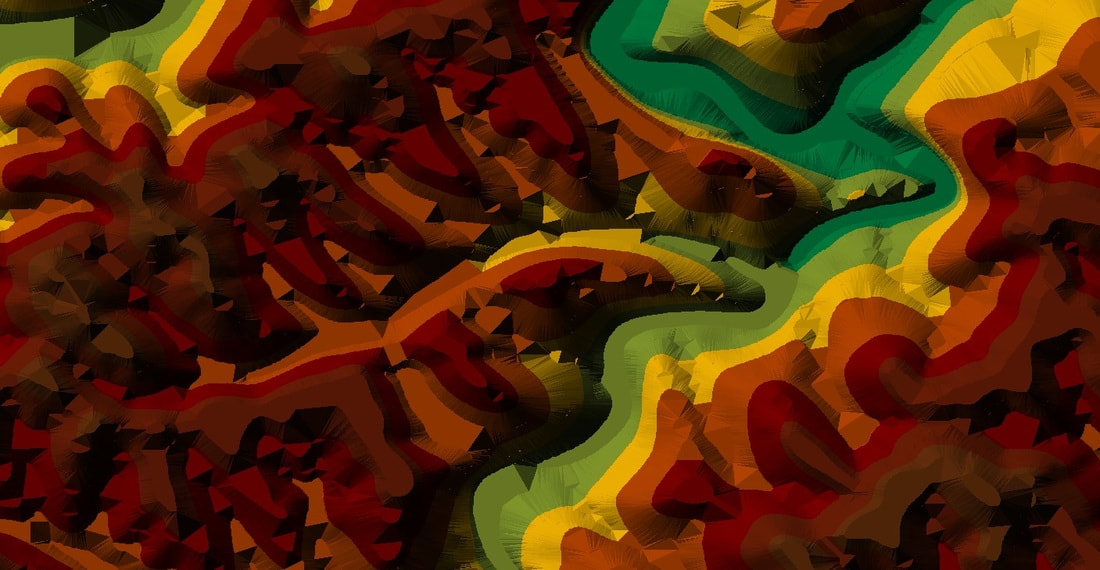
Figure 5: Perryville Battlefield TIN, same as Figure3
A TIN (Triangular Irregular Network)[4] is a vector model, which is another form of simulated three dimensional viewing, based on the Contour which was created from the DEM. It is constructed using the Create TIN tool in the TIN tray under Data Management in the 3D Analysis tools in the Esri ArcToolbox. The Create TIN tool only requires the location of the contour file, the output file name and storage location should be specified. Creating the TIN is a relatively slow process because of the mathematical calculations that are required. When exploring the results, such as zooming, the image will redraw.
HISTORICAL MAPS
[1] http://nationalmap.gov/3dep_prodserv.html
[2] http://en.wikipedia.org/wiki/Digital_elevatin_model
[3] http://kymartian.ky.gov/demwebusgs/
[4] http://en.wikipedia.org/wiki/Triangulated_irregular_network
HISTORICAL MAPS
[1] http://nationalmap.gov/3dep_prodserv.html
[2] http://en.wikipedia.org/wiki/Digital_elevatin_model
[3] http://kymartian.ky.gov/demwebusgs/
[4] http://en.wikipedia.org/wiki/Triangulated_irregular_network
